Zoom services such as DAM/MAM database service, Preview Service, Curator Service use the Java Virtual Machine (JVM). As the number of files and user load increase the system administrators should periodically instrument the JVM and review the performance graphs. This article describes how the Zoom Server’s JVM can be configured for monitoring & profiling:
- Hear Memory Usage
- Garbage collection pauses
- Thread usage
Before you begin
For Zoom Server, please check the memory usage by the JVM by visiting the URL: https://{your-server-name}:9443/jsp/status/stats.jsp. In addition please check the performance metrics at https://{your-server-name}:9443/jsp/status/sessions.jsp. These should give you an idea about memory usage and performance metrics before you do the exercise below.
JConsole based profiling
The JConsole graphical user interface is a monitoring tool that complies to the Java Management Extensions (JMX) specification. JConsole uses the extensive instrumentation of the Java Virtual Machine (Java VM) to provide information about the performance and resource consumption of applications running on the Java platform.
Connecting JConsole to the running Zoom Service
On Windows Server using direct process connect
- Download the full JDK (64 bit) version being used by Zoom Service (1.8.0 as the time of writing)
- Install the JDK on the Windows Server machine under the same admin account running the Zoom Service
- Locate the jconsole.exe from the installed JDK. For example C:\Program Files\jdk1.8.0_171\bin\jconsole.exe
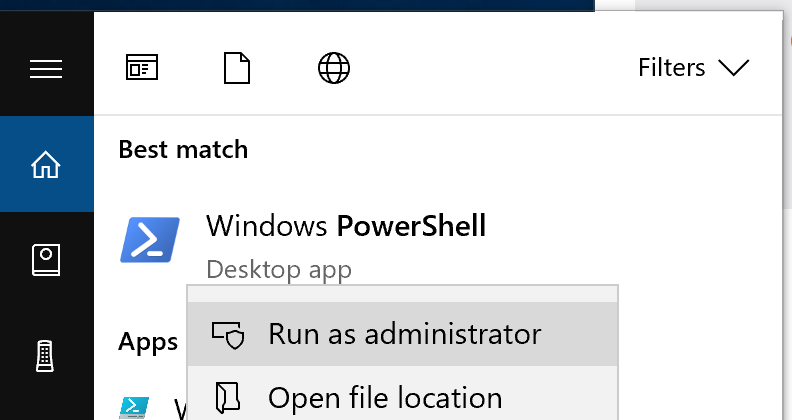
- Run a Windows PowerShell as an Administrator:
- Next open the Windows task manager or services console and locate the PID (Process ID) of the Zoom Server’s JVM by looking for a process with name “java.exe”
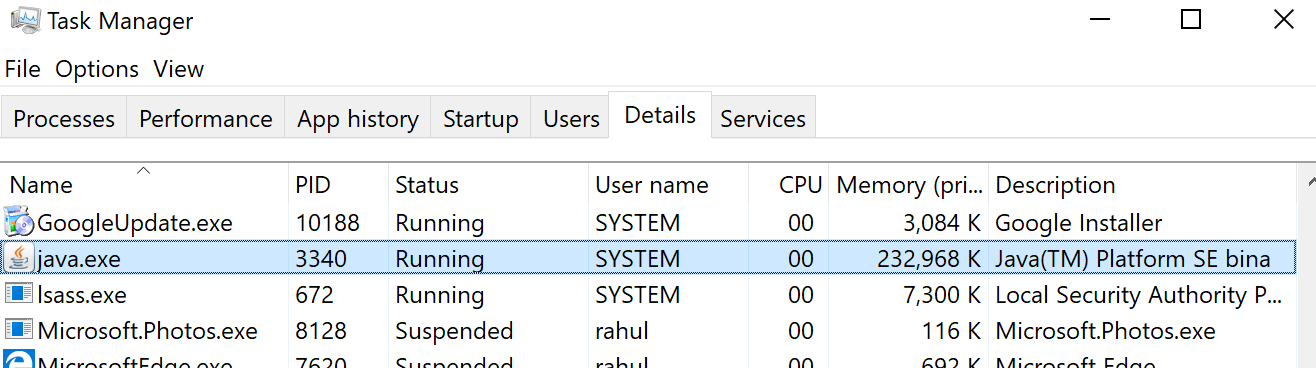
Please ensure you locate the PID of the correct Zoom Server JVM process especially if you are running multiple JVMs on the Windows Server machine. The best way is to go the Services tab in the Task Manager, locate the Zoom Service and right clock on the
Go to Detailsmenu option: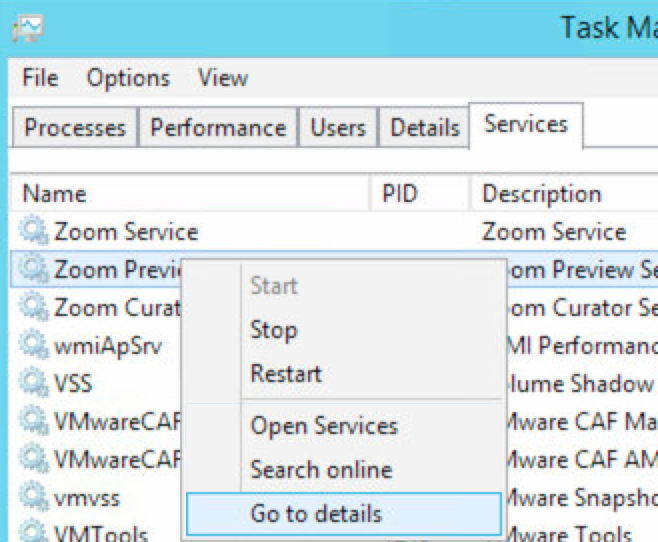
- In the Windows PowerShell terminal opened in the previous step, execute the jconsole.exe to connect to the JVM PID. For example, if the Zoom Server java/JVM PID is 3140:
<path to jconsole>\jconsole <Zoom Server’s JVM/java.exe PID>

- This should launch the GUI console for the Zoom Server JVM where you can record and view the timeline graphs of various resources such as Memory
If the Windows jconsole app fails to connect to the JVM or fails to find the process ID of the Zoom Service’s JVM, please use the JMX remote port method described below for Linux Server.
On Linux Server using JMX remote port
- Download & install the full JDK (64 bit) version being used by Zoom Service (1.8.0 as the time of writing) to a Mac or a Windows Desktop
- Locate the jconsole.exe from the installed JDK. For example on Windows: C:\Program Files\jdk1.8.0_171\bin\jconsole.exe or on Mac: /Applications/Java/jdk1.8.0_171/bin/console
- Now ssh or open a shell on the Linux server running the Zoom Service. Locate the Zoom install directory and open the wrapper.conf file. For example:

- Edit the above file and add the following lines: wrapper.java.additional.21=-Dcom.sun.management.jmxremote.port=9999
wrapper.java.additional.22=-Dcom.sun.management.jmxremote.authenticate=false
wrapper.java.additional.23=-Dcom.sun.management.jmxremote.ssl=false
wrapper.java.additional.24=-Djava.rmi.server.hostname=<Zoom Server IP address>Please change the Zoom Server IP address to your Linux server’s actual IP address. Also, note the additional argument count (.21 above) needs to line up with your existing wrapper.conf line count. If .wrapper.java.additional.21 is already used then you will need to start at wrapper.java.additional..22 and go up to wrapper.java.additional.25 - Open the JMX port (9999 in the above example) to allow the Mac or Windows desktop that you installed the JDK on to connect remotely.
- Execute jconsole on the Mac or Windows desktop and select Remote Process, enter <Zoom Server IP>:9999 and follow prompt to connect with the Zoom Server JVM
Using JConsole
- Memory Profiling: Record the Heap Memory usage for 1 full day by restarting the Zoom Service afresh before the user workload starts say at 8:00 AM and let the jconsole app track for 1 day the graph:


- Please export the raw data by by right clicking and selecting ‘Save data as..’ to csv. Also please take screenshots of the various resource graph to share with Evolphin Support team if needed and for your own record for that day.

- After profiling is complete you can stop the jconsole app and remove the JMX configuration lines (Linux Server) that you might have added to the Zoom Server’s wrapper.conf file
Verbose GC Log
These GC logs are useful to view more detailed GC activity on the JVM. After you have completed the jconsole based profiling described above and cleaned out any JMX settings from the Zoom Server’s wrapper.conf file, re-open the wrapper.conf file for the Linux or Windows server using a text editor such as NotePad++ on Windows or using vim on Linux and add the following lines based on the last additional parameter number in wrapper.conf. For e.g. if the last parameter was .20 then:
wrapper.java.additional.22=-verbose:gc
wrapper.java.additional.23=-XX:+PrintGCDateStamps
wrapper.java.additional.24=-XX:+PrintGCDetails
wrapper.java.additional.25=-XX:+PrintGCApplicationStoppedTime
wrapper.java.additional.26=-XX:+PrintGCApplicationConcurrentTime
The above profiling can be done on any of the Zoom java based services including:
- Zoom Service (database)
- Preview Service
- Curator Service (Indexing)
Please change the name of the gc log in the above configuration file for each JVM based Service (Zoom Server, Preview Server, Curator Server) to ensure files don’t conflict if they are running on the same server machine.
Once you have done a run such as a full day of Zoom Service JVM running with the above wrapper.conf changes, it’s time to visualize the GC logs. This can be done using a tool such as HPjmeter:
- Download & install HPjmeter to a Mac or Windows desktop from https://h20392.www2.hpe.com/portal/swdepot/displayProductInfo.do?productNumber=HPJMETERSW
- Download & install the full JDK (64 bit) version being used by Zoom Service (1.8.0 as the time of writing) to a Mac or a Windows Desktop
- From a terminal (Windows PowerShell or Mac terminal) launch the app by using the java executable that was installed as part of the JDK install above. For example:
$ java -jar HPjmeter.jar
- Copy the gc log file, created on the Zoom server via the wrapper.conf verbose GC parameters, to the machine running the HPjmeter
- From the file menu open the GC log file:

- View the various graphs in the HPjmeter GUI, use the Duration tab to view the GC pauses on the Zoom Server JVM:
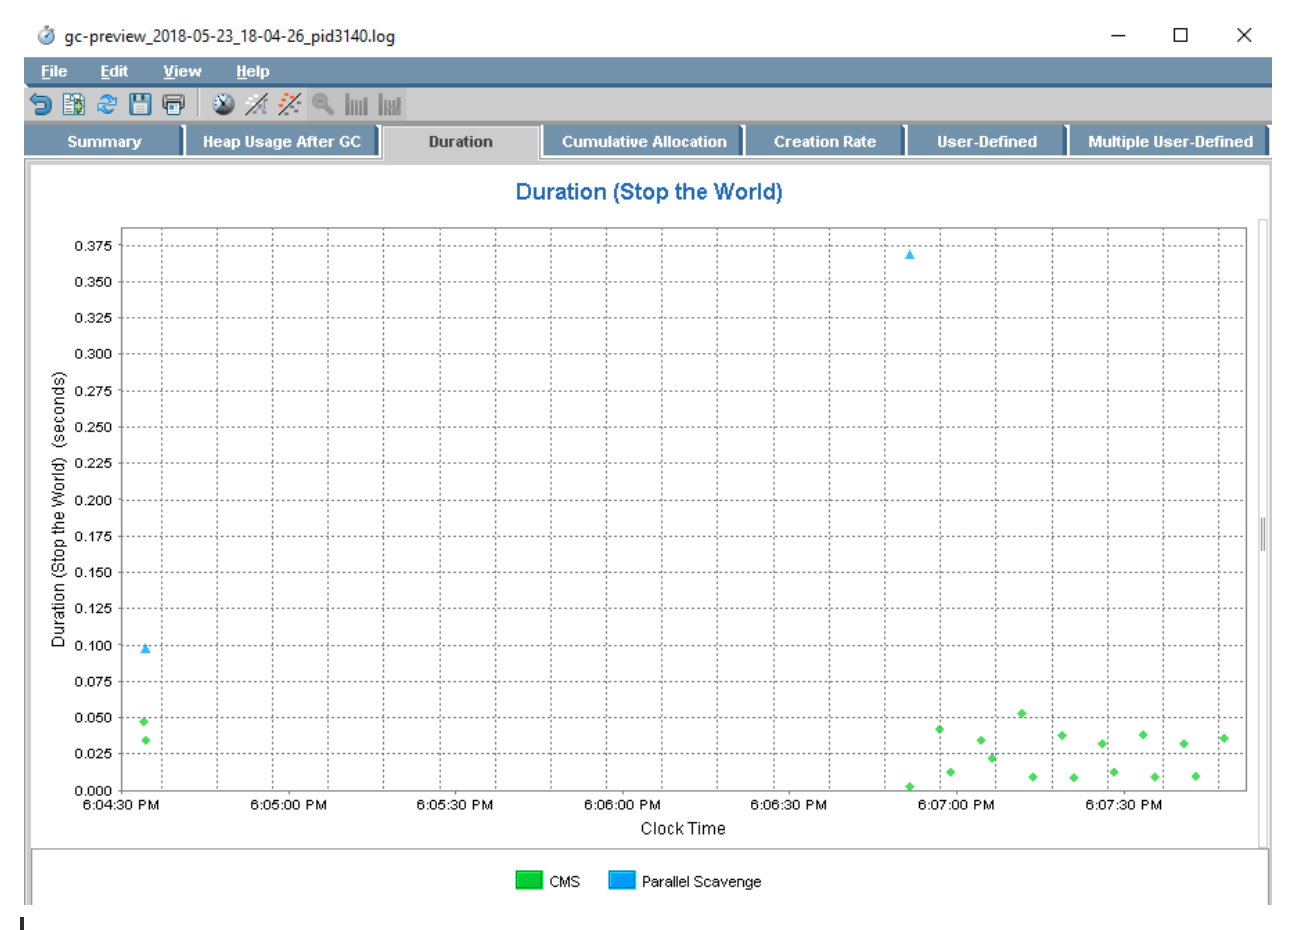
- Any GC pauses shown on the Y-Axis as duration (seconds) that exceed 1-2s indicate the JVM needs more memory. Watch for full GC pauses markers and the note the duration. Any long pauses that stall the JVM for a few seconds will need to be investigated. Most of the time the JVM memory settings in the conf file need to be tweaked to make the GC pauses minimal and reduce any sudden slow down of Zoom apps such as Asset Browser. Tell tale sign of GC pauses is if users complain that list/browse operations on the Asset Browser are taking a long time.