After installing and configuring Hub, as soon as you are finished setting up your AI provider, configuration, and mappings in Zoom, your AI module in Zoom starts locating existing assets in the Zoom repository to be eligible for AI analysis. If any existing or new assets match your configured AI mapping rules, these are sent over to your AI Provider. In the case of Veritone AI provider, these are sent to a shared A3 bucket. The process is managed by the Hub Server and the progress of an AI job can be viewed on the Hub Dashboard.
When the process finishes and AI data is returned by your AI provider, it is saved into Zoom and can be viewed along with other metadata for the analyzed assets inside WebClient. The flow is shown below.
AI analyzed asset in Web Client
For a video
The most common forms of analysis used on videos include transcription (speech to text), object detection, logo detection, and celebrity detection. Zoom displays the AI-generated tags as data timelines in the Web Client’s data timeline view. Each AI engine creates its own data timeline.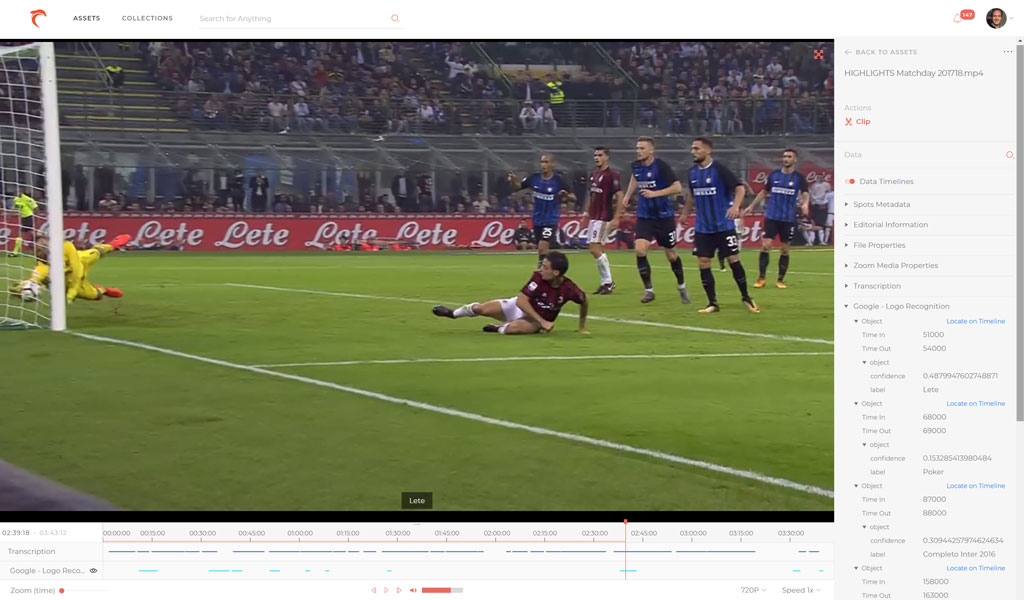
 icon next to each layer in the timeline.
Additionally, expanding the metadata in the right panel will display Locate links that you can click to be brought to that frame in the video.
icon next to each layer in the timeline.
Additionally, expanding the metadata in the right panel will display Locate links that you can click to be brought to that frame in the video.
For an image
Text (OCR) and object recognition are most commonly employed for images as shown in the screen below.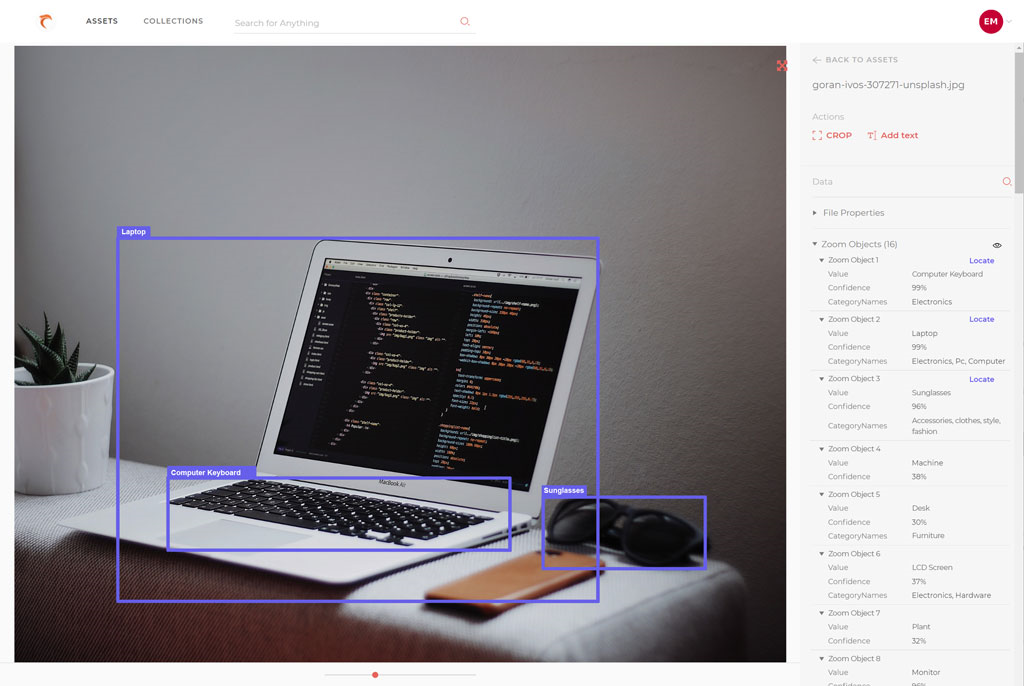
button next to the data layer name in the right-side panel. If locator boxes were returned by the AI engine, they will be displayed over the image so you can see which tag corresponds to which area in the image.
You can also expand the metadata on the right panel to show Locate links for toggling the data point marked on the asset.
AI Jobs Dashboard
The AI jobs are managed by the Hub Server, so you need access to the Hub Server to view the AI Jobs Dashboard.
Access the AI Jobs Dashboard using the Hub Server IP at http://[HubIP]:8282/
The AI Dashboard is shown.
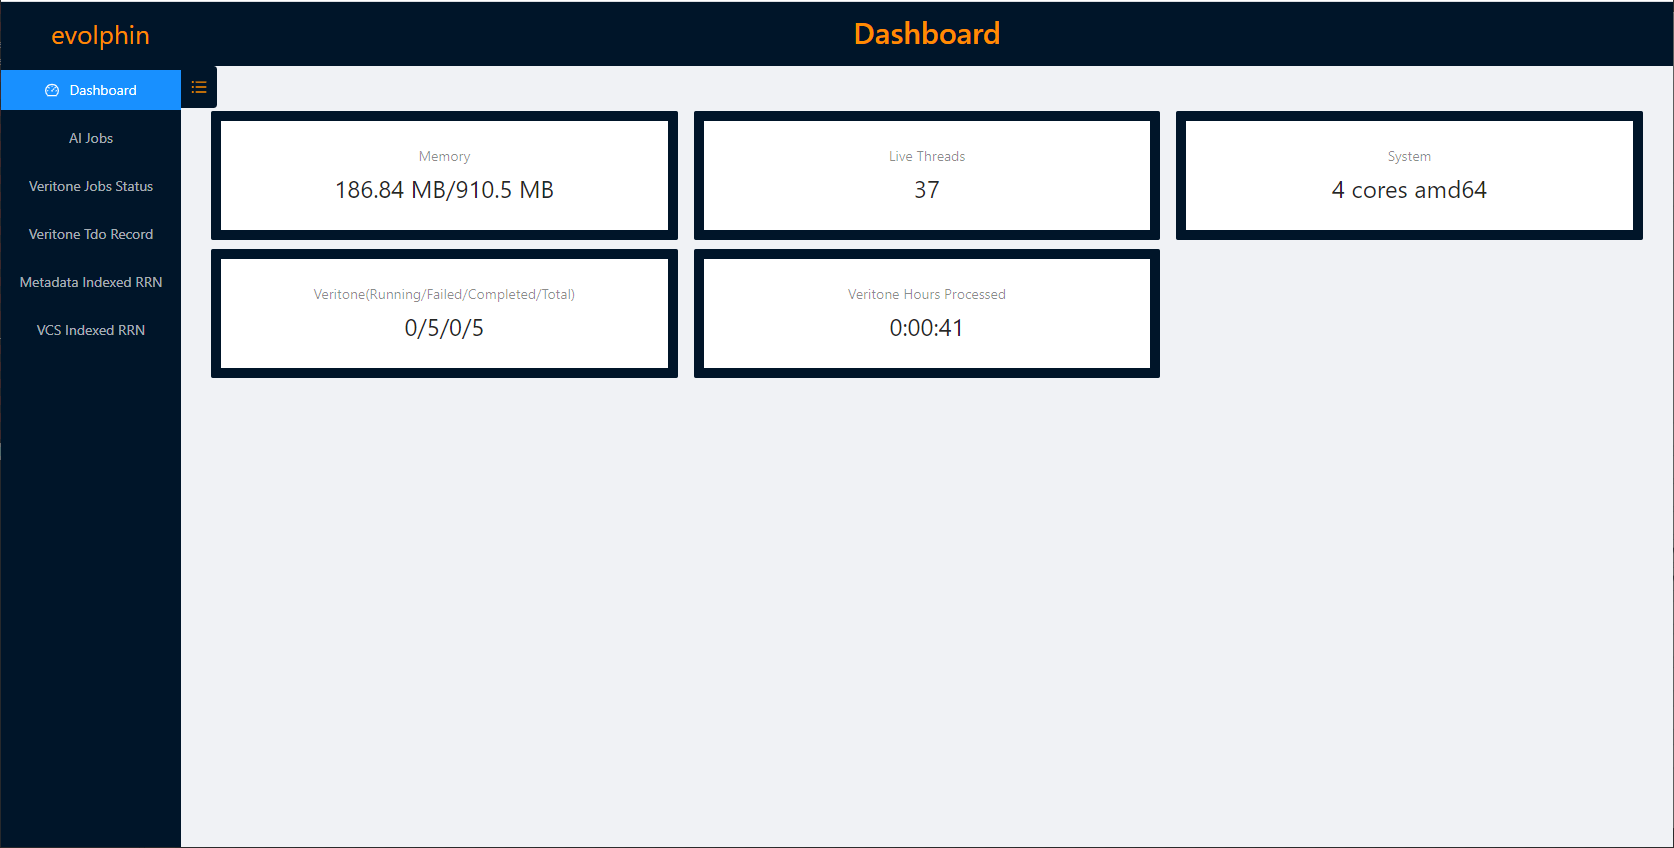
It shows system information about the AI processes in Zoom. Click AI Jobs to see the jobs on the server.
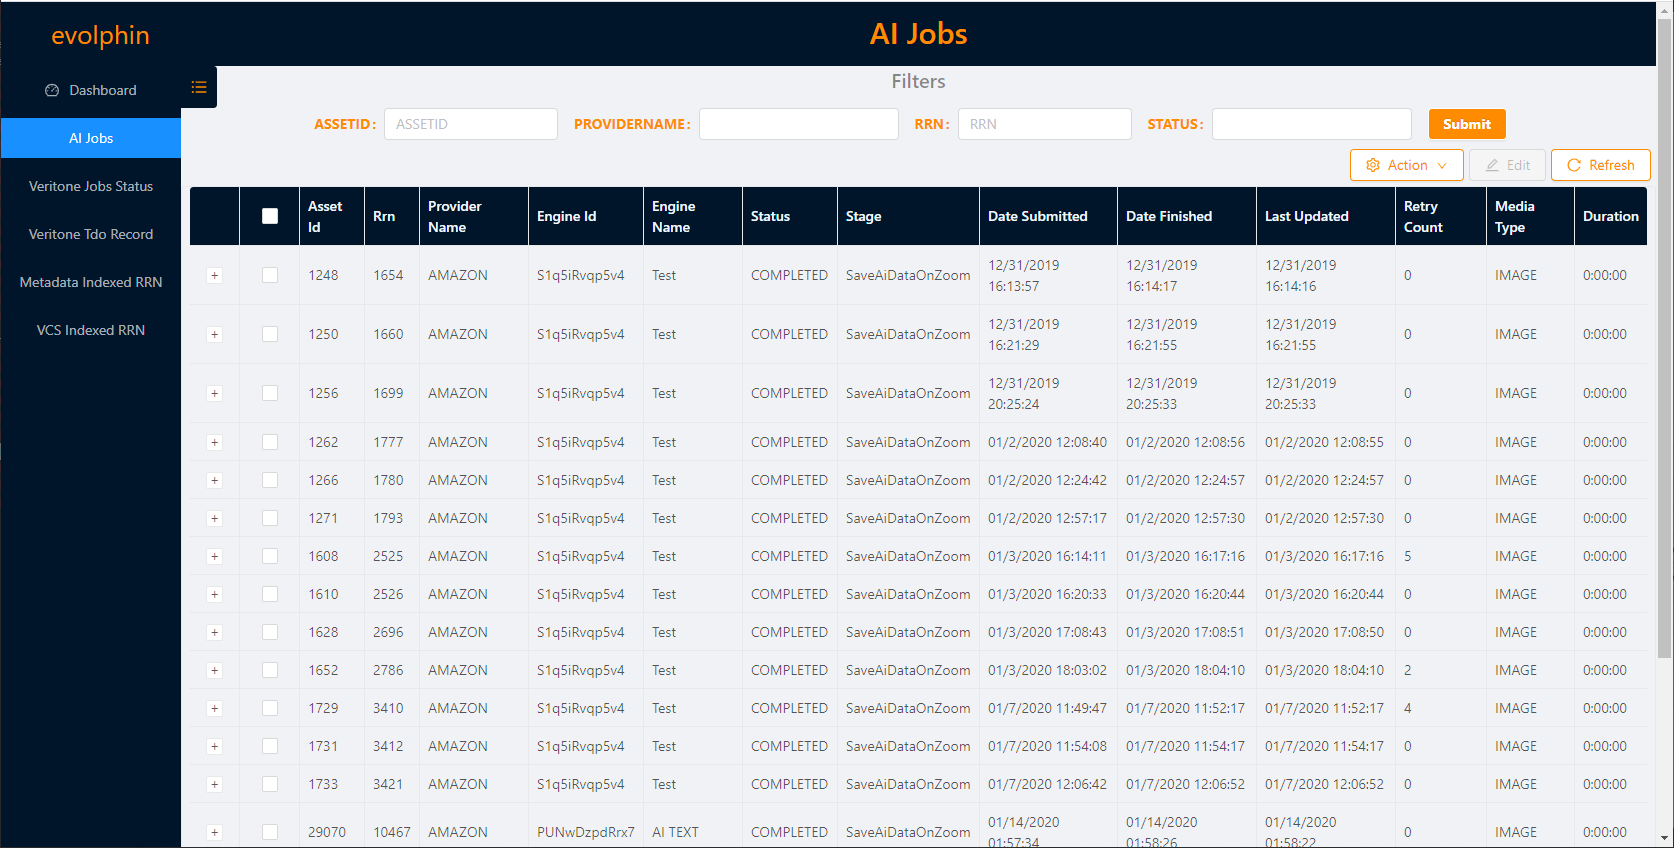
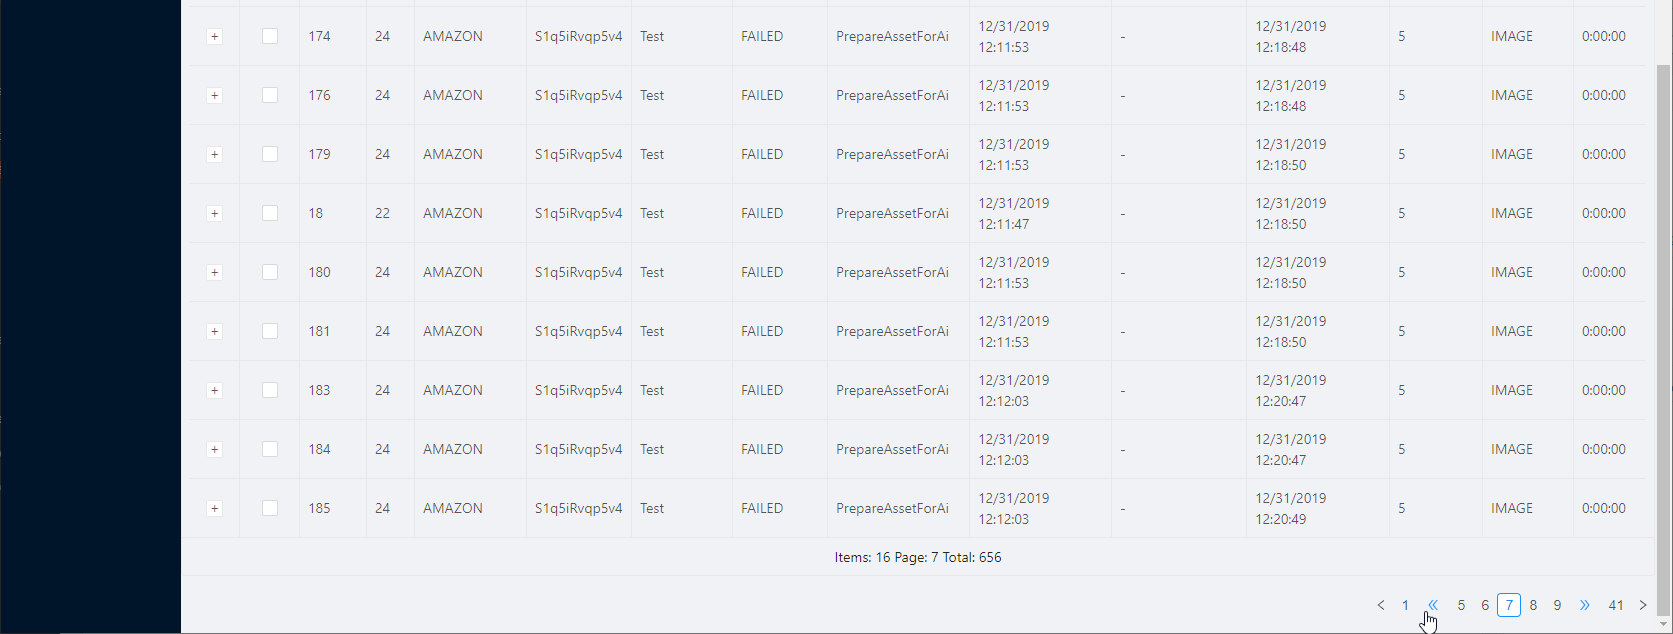
The jobs are listed in reverse chronological order, with the latest jobs showing on top. If there are multiple pages then you can scroll using the Page number links on the bottom right or the Previous Page and Next Page buttons. You can also jump 5 pages in front or back by clicking the Previous 5 Pages or Next 5 Pages buttons that appear in place of the … shown for multiple pages.
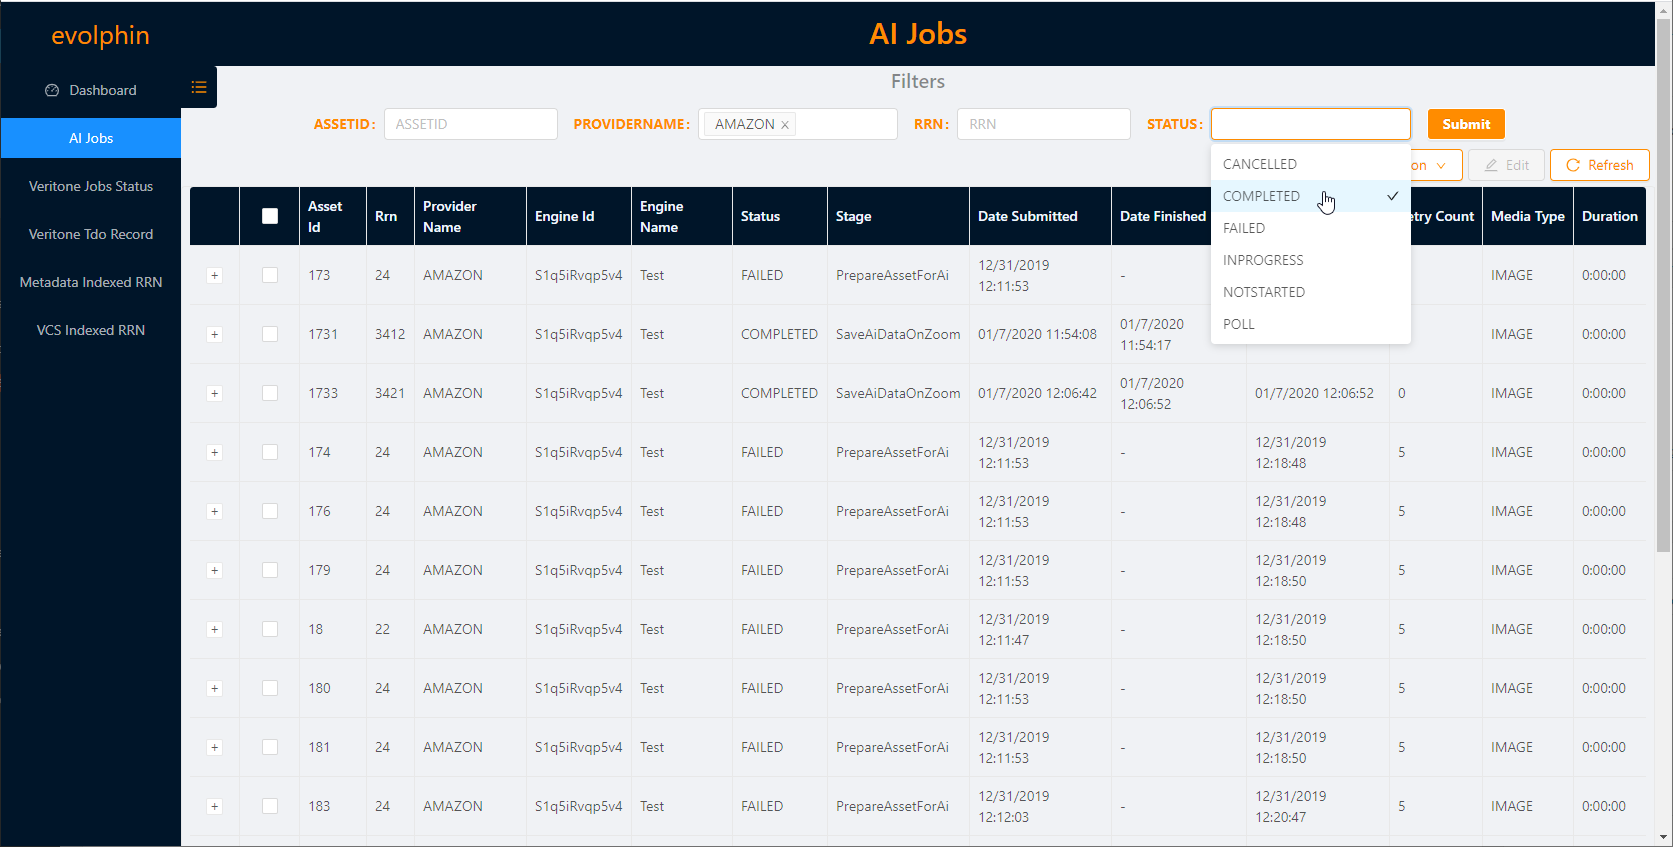
You can filter jobs based on a few criteria listed on the top. Specify one or more of the filters and click Submit to apply the filters on the jobs listed below.
You have the option to select one or more jobs, by selecting the checkbox in front of their row. Select one or more jobs and click Edit to edit the details saved with the job. You can also select one or more jobs and select an Action from the Action dropdown in the top right.
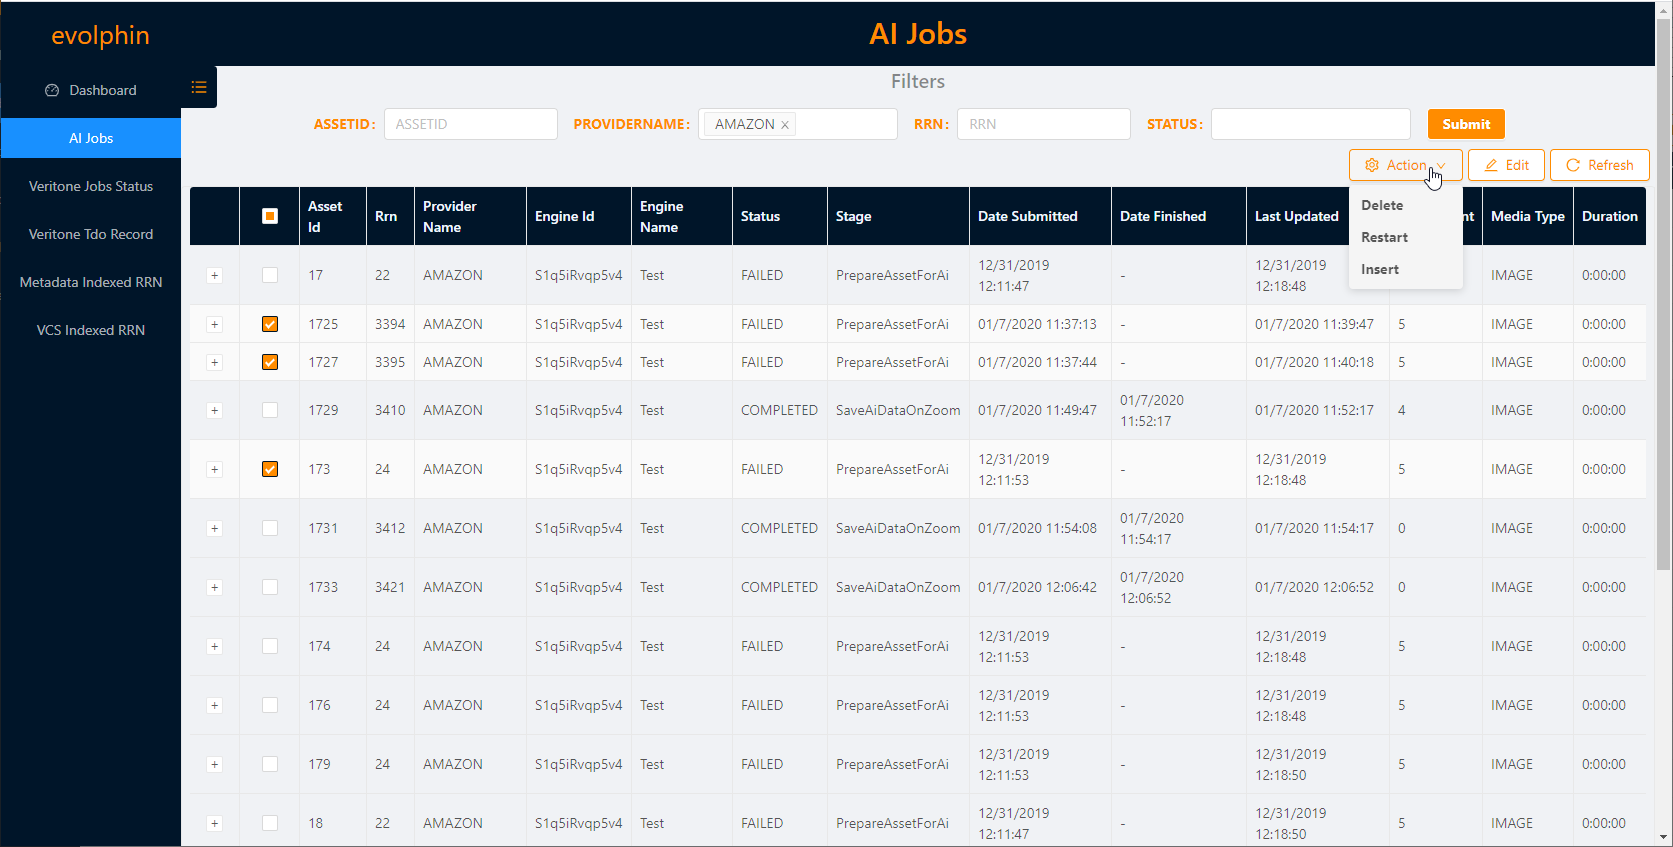
Select Delete to delete that job. Any job that has started to execute on the external AI Provider will continue to be worked on.
Select Restart to start a failed job.
Select Insert to insert a new job record.
Click the + before a job row to view more details about the job.
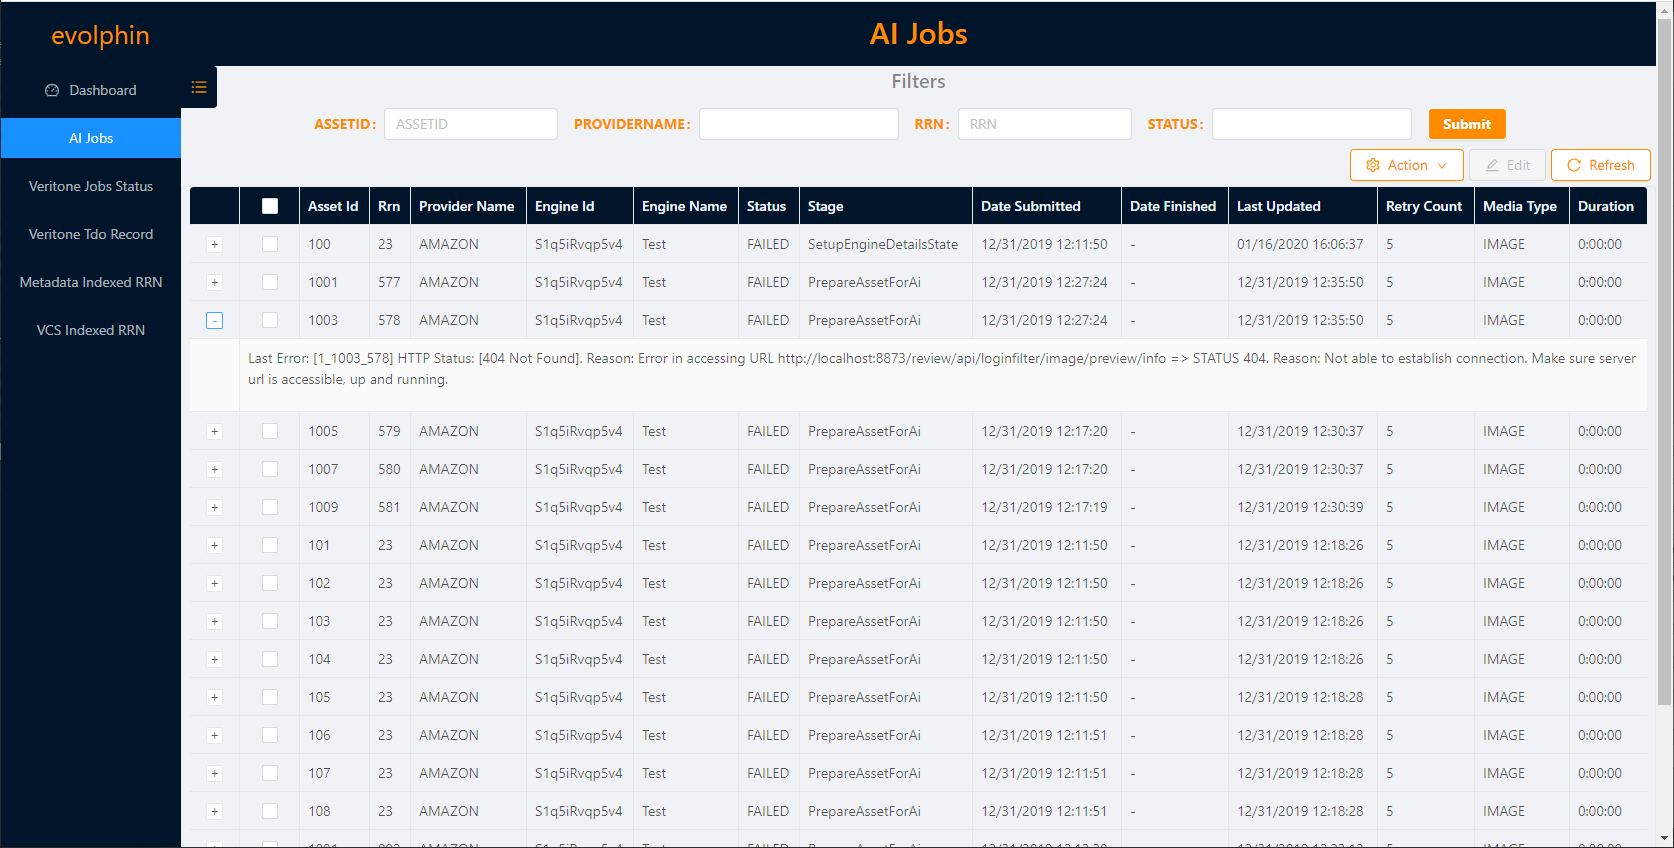
The details depend on the status of the job. For completed jobs, it shows the assets affected.
For failed jobs, it shows the reason for failure.
Click Refresh to reload the data.